Nearly half of all emails sent in 2025 got flagged as unwanted by spam filters and categorization algorithms. Out of all those carefully crafted campaigns, many never made it to primary inboxes (or got sorted into tabs people rarely check).
We conducted exhaustive research (both primary and secondary) to compile a comprehensive report that analyzes and interprets data related to inbox placement in the B2B context.
Key findings
Here’s a summary of what we found:
~46–47% of all email traffic is classified as spam or unwanted
≈176B spam emails circulate daily (376.4B × 0.468)
10.5% land in spam folders; another 6.4% vanish entirely
Gmail Promotions now captures the majority of marketing emails
AI-powered phishing jumped 466% in Q1 2025
Microsoft’s authentication mandate (enforced May 5, 2025) automatically dumps non-compliant emails into junk folders. Meanwhile, machine learning filters continue to improve at distinguishing between promotional content and personal messages. If you’re ignoring proper authentication, email list hygiene, and engagement metrics, you’re hemorrhaging money.
What’s happening with global email right now?
Email remains the backbone of digital communication despite predictions of its demise — and it’s showing explosive growth that shows no signs of slowing.
Email traffic hit 376.4 billion messages daily in 2025, up from 361.6 billion in 2024 (that’s 4% year-over-year growth). Every second, 4.36 million emails cross the internet. While you read this sentence, roughly 20 million emails just got sent.
4.6 billion people use email globally (57% of humanity). Since most people maintain two accounts, total active addresses exceed 8 billion. 93% check email daily, with 58% opening their inbox before they’ve finished their morning coffee.
But the brutal reality is… that around 46-47% of all email is spam. That’s 176 billion junk messages every single day. Spam percentages actually dropped from 56.6% in 2017 to today’s 47% (a notable improvement, right?), but absolute volumes continue to climb because legitimate email volumes grow even faster. The problem isn’t shrinking. It’s just getting diluted by growth.
Email volume trends (2017-2025)
Understanding how email volume has evolved helps you see why spam remains a persistent problem, even as its percentage declines.
Show data table
| Year | Daily Email Volume | Spam Percentage | Daily Spam Volume |
|---|---|---|---|
| 2017 | 269 B | 56.6% | 152 B |
| 2022 | 333 B | 50.0% | 167 B |
| 2023 | 347 B | 45.6% | 158 B |
| 2024 | 362 B | 46.8% | 169 B |
| 2025 | 376 B | 46.8% | 176 B |
Tip: Hover the chart to see exact values. Bars are billions/day; the line is spam %.
Sources: Statista, Mailmodo, DeBounce
Who controls your inbox?
When measured by email opens (the most reliable metric), Litmus data from September 2025 show that Apple Mail clients (iPhone, iPad, Mac) command roughly a 46% market share. Gmail accounts for about 24% of opens, while Outlook desktop captures around 3.5% (with Outlook.com measured separately).

However, the distribution of user accounts tells a different story. Consumer surveys indicate that approximately 72% of people have a Gmail address, making it the most widely used email service globally. Roughly 20% maintain Yahoo accounts. Gmail usually serves as the primary account, while others function as backups or spam catchers.
Email client market share comparison
The distinction between who has an account versus who uses which client matters enormously for your deliverability strategy.
- Apple Mail (~46%)
- Gmail (~24%)
- Outlook (~3.5%)
- Yahoo/AOL & Others (~26.5%)
Source: Litmus Email Client Market Share, DeBounce
The distinction matters because someone might have a Gmail account but read emails primarily on their iPhone using Apple Mail. Your deliverability strategy must account for both email provider filters (such as Gmail’s algorithms) and email client rendering (as seen in Apple Mail’s display).
Where does spam actually come from?
Geographic spam patterns shift constantly as enforcement varies by country and botnet operators relocate infrastructure. Recent data from security researchers reveals concentration in specific regions.
Countries sending the most spam daily (as of late 2024):
Show data table
| Country | Spam Emails (~Billions) |
|---|---|
| United States | 8.0 |
| China | 7.6 |
| Russia | 7.3 |
| Germany | 7.3 |
Note: Values are approximate as provided (~). Unit shown is billions.
These rankings fluctuate based on:
- Botnet takedowns
- Regulatory crackdowns
- Shifts in the criminal infrastructure
What remains constant? Spam originates from countries with either massive internet populations or lax enforcement against abuse.
What kind of spam fills inboxes?
Marketing and advertising emails dominate spam categories (ironically, many are from legitimate businesses with terrible list hygiene practices), followed by adult content and financial scams.
| Spam Type | Percentage of Total Spam | Risk Level |
| Marketing/Advertising | 36% | Low (annoying) |
| Adult Content | 31.7% | Medium (malware risk) |
| Financial Scams | 26.5% | High (theft risk) |
| Phishing | 2.5% (~73% of fraud emails) | Critical (data breach) |
Sources: Mailmodo, Keepnet Labs
Phishing and email scams account for only about 1.2% of total traffic (approximately 3.4 billion daily) but cause disproportionate financial damage. The average phishing breach costs $4.88 million, according to IBM’s 2024 data. That small percentage becomes incredibly expensive when it hits your organization.
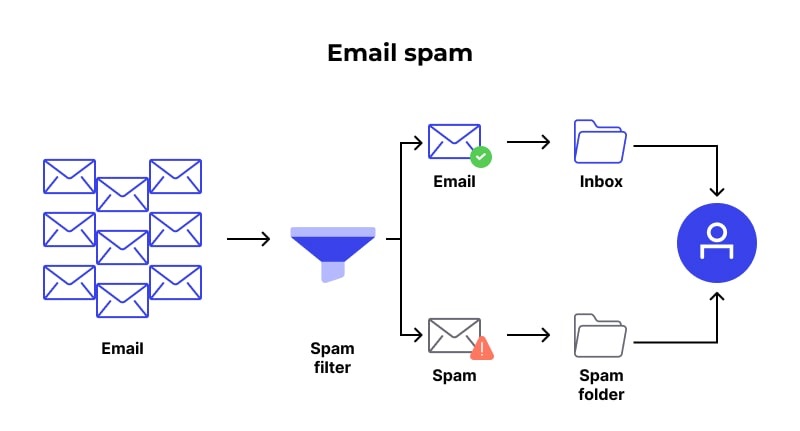
How much email actually reaches inboxes?
Most marketers have no idea how much email vanishes before recipients ever see it. Testing across multiple providers via an email deliverability test reveals sobering statistics that should alarm anyone relying on email for revenue.
According to EmailToolTester’s January 2024 testing, the average deliverability across 15 major email providers is 83.1%. That means 17% of your emails fail.
Where do they go?
- 10.5% land in spam folders
- 6.4% vanish entirely (blocked or undelivered)
1 in 6 marketing emails never reach the inbox. For companies sending 500,000 emails monthly, that’s 83,000 messages disappearing into the void. If your average customer value is $200, you may be potentially losing millions of dollars in revenue annually.
Email deliverability breakdown
Understanding where your emails actually end up is the first step toward fixing deliverability problems.
- Primary Inbox (83.1%)
- Spam Folder (10.5%)
- Completely Lost (6.4%)
- Total Failure (Spam+Lost) = 16.9%
Center label shows Total Failure (Spam + Lost). Hover slices for details.
Source: EmailToolTester Deliverability Test
Just so you know, these figures represent averages across the tested email service providers. Your actual deliverability depends heavily on sender reputation, authentication setup, list quality, and industry. B2B transactional emails often perform better, while promotional emails to consumers face steeper filtering.
Provider differences matter
Gmail blocks over 15 billion spam emails daily while intercepting 100 million phishing attempts. These massive interception volumes demonstrate the scale of filtering infrastructure required.
Different providers apply varying filtering philosophies. Some prioritize blocking potential threats (resulting in higher false positives that catch legitimate senders). In contrast, others focus on user engagement signals (routing low-engagement mail to secondary folders rather than blocking it outright).
How Gmail decides your fate
Gmail no longer uses simple keyword matching. Words like “sale,” “discount,” “offer,” or “limited time” don’t automatically trigger spam filters. The concentration of marketing terms signals promotional intent, but authentication and engagement matter far more.
Gmail watches how users interact with similar emails. When recipients consistently open, read, and respond to your messages, future emails get preferential treatment. When users ignore or delete your messages without opening them, future emails may face steeper filtering (regardless of perfect technical authentication).
Your sender reputation trumps your content quality. A perfectly crafted email sent to an unengaged list will land in spam faster than a mediocre email sent to engaged subscribers. The algorithm rewards relationships, not cleverness.
Does geography affect email delivery?
Regional filtering effectiveness varies significantly, reflecting differences in regulations and email infrastructure maturity. If you’re sending internationally, understanding these patterns becomes critical for campaign success.
Regional performance patterns
Inbox placement rates differ substantially across regions, driven primarily by regulatory environments and enforcement rigor:
| Region | Typical inbox rate | Key factor |
| Europe | 80-91% | GDPR enforcement |
| North America | 84-88% | Fragmented state laws, but the CAN-SPAM Act works as a federal law |
| Latin America | 85-87% (improving) | Recent LGPD laws |
| Asia-Pacific | ~78% | Varied enforcement |
Please note that the exact percentages may vary depending on the testing methodology and sample size. Ranges reflect patterns across multiple industry studies.
Europe consistently shows the strongest inbox placement, directly correlating with GDPR’s strict consent requirements. When senders must obtain explicit permission before emailing, list quality improves dramatically (which filters reward). The Asia-Pacific region often experiences lower delivery rates, with over 20% of emails being filtered or failing.
Latin America has experienced significant improvements over the past two years following the implementation of Brazil’s LGPD and similar legislation in neighboring countries. Regulatory frameworks directly influence email ecosystem health. Stricter laws force cleaner practices, which paradoxically improve deliverability for compliant senders.
Country-level patterns
Within regions, individual countries show notable performance variations. Germany and Australia frequently rank among the top global performers for email deliverability (thanks to strict consent practices and modern infrastructure) — some emerging markets experience significantly lower inbox placement due to less mature infrastructure and looser enforcement.
Canada consistently outperforms the United States by several percentage points. Canada’s Anti-Spam Law (CASL) forces companies to maintain cleaner lists and honor unsubscribe requests promptly, resulting in measurably better performance despite similar technical infrastructure.
The lesson here is to know that regions enforcing permission-based email practices see dramatically better deliverability. If you’re targeting international audiences, you need region-specific strategies that take into account local regulations and filtering patterns.
What’s happening with Gmail’s Promotions tab?
Gmail’s categorization algorithms became significantly more aggressive in late 2024. Many marketers noticed dramatic shifts in where their emails landed (and the change caught most people off guard).
The 2024-2025 filtering change
Email deliverability consultants and experts reported a major shift during late 2024. Senders who previously saw balanced splits between Primary and Promotions experienced dramatic changes. Some now see only 25% reaching Primary and 75% landing in Promotions (though exact percentages vary significantly by sender reputation, content type, and engagement history).
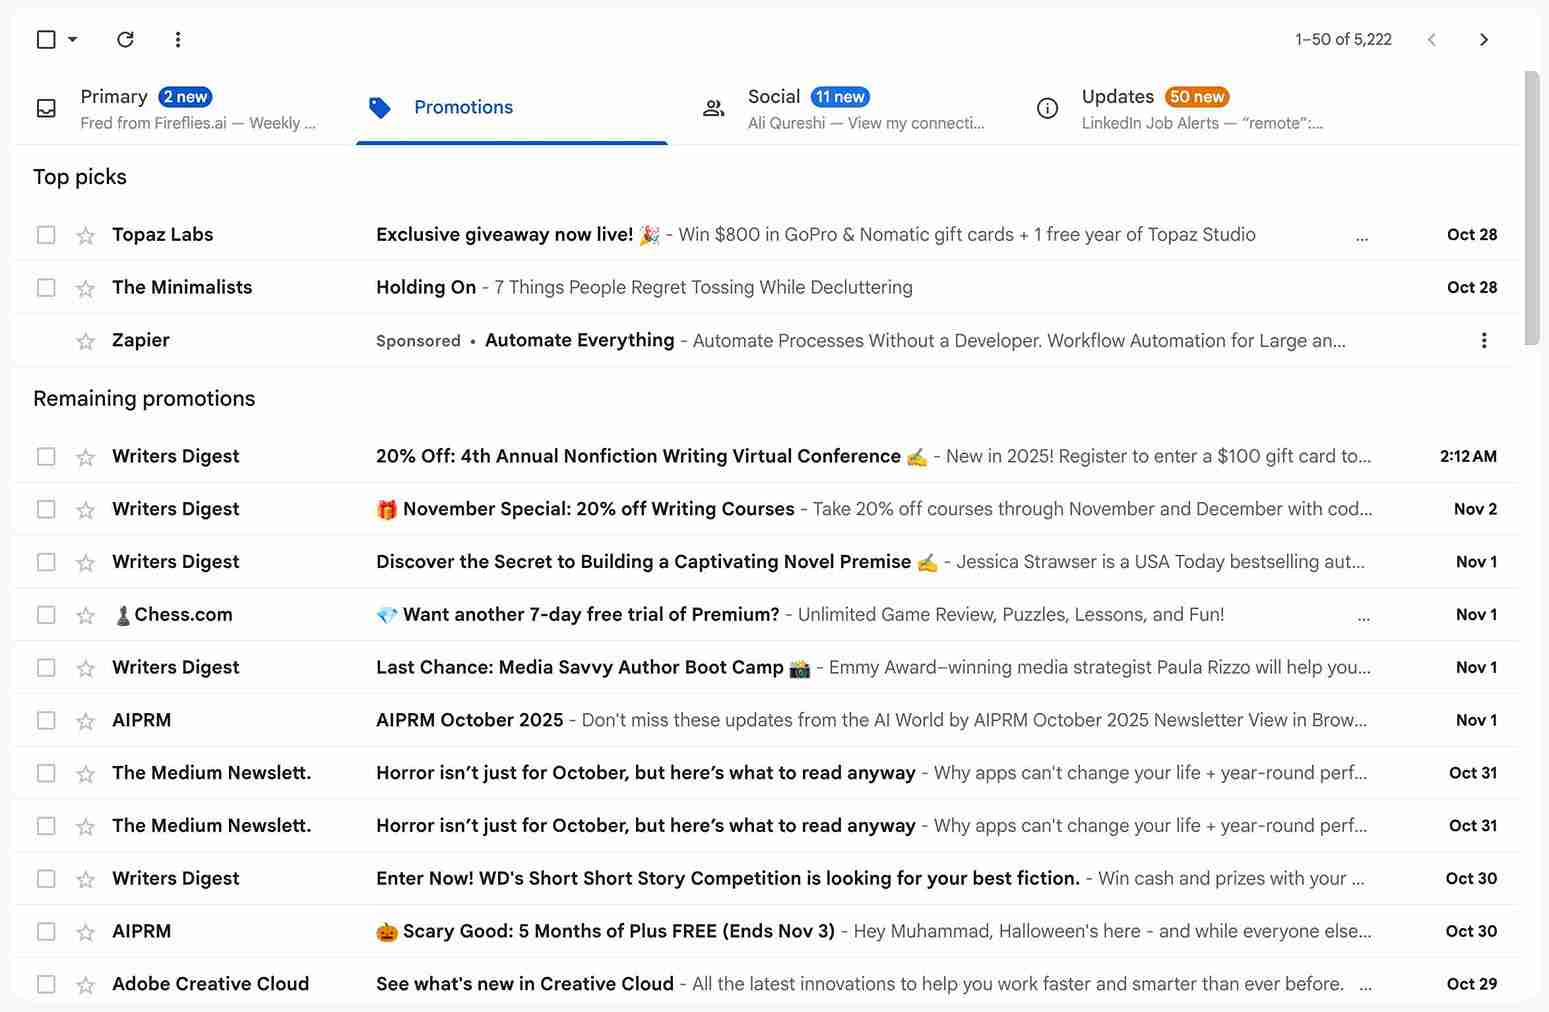
The shift intensified during the 2024 holiday season and remained elevated into 2025. Gmail has permanently recalibrated its categorization algorithms. The trend is clear: most commercial email now gets classified as promotional content (whether you like it or not).
Why Promotions isn’t the kiss of death
Here’s what most marketers misunderstand: the Promotions tab fundamentally differs from spam. Your emails are delivered and accessible (just sorted separately). Research shows varying data on actual usage patterns:
Gmail Promotions tab usage statistics
Different studies show different adoption rates, but all agree that a substantial portion of users actively check their Promotions tab.
| Study | Tab Usage Enabled | Check Daily | Never Check |
| ActiveCampaign | ~20% | 45% | Not reported |
| Sinch Mailjet | 53% | 51% | ~20% |
| Return Path | 60% | 45% | ~20% |
Sources: ActiveCampaign, Email on Acid
The discrepancy likely reflects different survey methodologies and populations. What’s clear: a substantial portion of Gmail users actively browse their Promotions tab. Users checking that tab are often in “shopping mode” (actively looking for offers and brand communications). These recipients can be highly engaged buyers, despite being placed in a secondary position.
Think about your own behavior. When you browse your Promotions tab, you’re deliberately looking for deals, updates from brands you care about, and newsletters you subscribed to. That’s a different mindset than checking Primary for urgent personal messages. Secondary placement doesn’t mean zero value.
Everyone’s implementing categorization now
Gmail isn’t alone in segmenting email anymore. Apple Mail introduced default inbox categories with iOS 18 in the fall of 2024, including Promotions alongside the Updates and Transactions tabs. Since Apple Mail accounts for roughly 46% of email opens (thanks to iPhone and iPad dominance), this change affects massive recipient volumes.
Inbox categorization across providers
The trend toward segmented inbox experiences is now universal across major email providers.
| Provider | Feature Name | When Launched | Default Categories |
| Gmail | Tabs | 2013 | Primary, Social, Promotions |
| Apple Mail | Inbox Categories | Fall 2024 | Primary, Transactions, Updates, Promotions |
| Yahoo | Views | 2015-2016 | Focused, Other |
| Outlook | Focused Inbox | 2016 | Focused, Other |
Sources: Apple Newsroom, various provider announcements
The trend among providers is shifting toward more segmented experiences. Your promotional emails are now delivered separately from personal messages. Fighting this categorization is futile. Savvy marketers adapt their strategies to work with these systems rather than against them.
What is Microsoft’s 2025 authentication mandate doing?
Microsoft’s new requirements (enforced starting May 5, 2025) fundamentally changed the email landscape. Many businesses were caught unprepared and saw their deliverability plummet overnight.
The enforcement timeline
Microsoft now requires high-volume senders (those exceeding 5,000 emails daily) to implement strict authentication, including SPF, DKIM, and DMARC. There are no exceptions or extensions of the grace period.
Microsoft’s 2025 authentication requirements
Understanding what Microsoft requires helps you avoid having your emails automatically junked or rejected.
| Requirement | What it does | Enforcement level |
| SPF (Sender Policy Framework) | Verifies authorized sending servers | Mandatory |
| DKIM (DomainKeys Identified Mail) | Confirms message integrity | Mandatory |
| DMARC (p=none minimum) | Ties SPF/DKIM together | Mandatory |
| Spam rate below 0.3% | Measures recipient complaints | Strongly enforced |
| One-click unsubscribe | Easy opt-out mechanism | Required |
Sources: Microsoft Tech Community, Mailgun
Phase 1 (started May 5, 2025)
Non-compliant emails from bulk senders are routed straight to Junk folders or get rejected. Your legitimate business emails suddenly become “spam,” not because they’re malicious, but because you failed a technical configuration. Recipients never see them. As a result, you lose sales, and your sender reputation tanks.
Microsoft initially planned to send non-compliant emails to Junk folders, but updated its policy to reject messages outright starting May 5, 2025. Rejected messages generate error code “550 5.7.515 Access denied, sending domain does not meet the required authentication level.”
Phase 2 (ongoing)
Microsoft continues to monitor and will increase the strictness of filtering for persistent offenders. Your emails bounce back undelivered, and Microsoft is brutal (no second chances).
Why do small businesses struggle more?
Small and medium-sized businesses face more stringent filtering challenges than enterprises. While exact percentages vary across studies, a consistent pattern emerges: smaller senders experience significantly higher spam rates compared to larger senders, who exceed one million emails monthly.
- Enterprises employ dedicated email infrastructure teams
- Small businesses lack resources for proper authentication implementation
- SMBs frequently use shared IP addresses (contaminated by others’ poor practices)
- Large senders benefit from established reputations and historical engagement data
The 2025 authentication mandates hit small businesses hardest. Enterprises have deliverability specialists who implemented DMARC years ago. SMBs often don’t know these requirements exist until open rates crater and customers complain they never received messages.
What you actually need to maintain
Success requires maintaining spam complaint rates strictly below 0.3% (Google’s explicit threshold for bulk senders). Many experts recommend aiming for a rate below 0.1% to maintain a cushion, although this is guidance rather than a hard requirement.
Critical compliance requirements:
- Remove unengaged subscribers regularly
- Monitor opens, clicks, and replies continuously
- Process unsubscribes within the required two-day window
ISPs now heavily weigh engagement in deliverability decisions. An email sent to an unengaged list with perfect authentication will still land in spam when recipients consistently ignore it. Technical compliance is necessary but insufficient. You need actual engagement.
How dangerous is AI-generated phishing right now?
While commercial promotions dominate filtered volume, malicious emails constitute the most serious security threat. Generative AI fundamentally altered the threat landscape in 2024-2025 (and it’s getting worse).
The AI explosion
In Q1 2025, phishing reports surged 466% according to Gen Digital’s threat research. Modern AI-generated phishing is linguistically perfect, contextually appropriate, and personally tailored. The days of spotting phishing by bad grammar ended abruptly.
Phishing emails account for approximately 1.2% of total global traffic, resulting in roughly 3.4 billion phishing emails sent daily. That small percentage creates disproportionate damage because AI dramatically increases success rates.
AI-powered threats by the numbers (2024-2025)
The explosion in AI-enhanced attacks represents a fundamental shift in the threat landscape that traditional defenses can’t handle.
| Threat Metric | 2024-2025 Data | Source |
| Phishing increase (Q1 2025) | 466% | Gen Digital |
| Breached data surge | 186% | Gen Digital |
| Average data breach cost | $4.88M | IBM |
| BEC losses (2024) | $2.77B | FBI IC3 |
| Human element in breaches | 68% | Verizon DBIR |
| Fake browser update scams increase | 17x | Gen Digital |
Recent studies suggest modern phishing achieves concerning effectiveness (though specific rates vary widely by attack sophistication and target population). What’s undeniable: AI-generated phishing performs significantly better than traditional attempts because it eliminates telltale signs people learned to recognize.
Business Email Compromise is the new frontier
BEC and pretexting incidents nearly doubled in frequency. These schemes bypass multi-factor authentication entirely by exploiting human trust rather than technical vulnerabilities (which makes them particularly dangerous).
An attacker impersonates your vendor, executive, or colleague and requests wire transfers or sensitive information. When the email looks perfect (thanks to AI), people comply. Modern attacks increasingly incorporate AI-powered deepfakes, including fake voice calls or video meetings that sound and look completely real.
The human element contributes to 68% of breaches, according to Verizon’s 2024 report. Your employees remain the weakest link, and AI makes exploiting them easier than ever. Technical defenses matter, but human training becomes critical when attackers can perfectly mimic writing styles, speech patterns, and visual appearance.
FBI data shows BEC caused $2.77 billion in losses during 2024. That’s just reported losses (actual totals likely far exceed this figure since many companies don’t report incidents publicly). The average organization faces mounting pressure to defend against threats that evolve faster than its security budget can keep pace with.
What does poor deliverability actually cost you?
Email delivers a strong ROI for most businesses. Recent studies show around $36 returned for every $1 invested on average, with high-performing segments reporting even higher returns.
When 17% of your emails vanish, you’re hemorrhaging revenue (and most companies don’t realize how much they’re losing). Consider a company sending 100,000 marketing emails monthly with an average order value of $150 and a 2% conversion rate. The deliverability difference creates massive revenue gaps:
Deliverability impact on revenue (monthly example)
Slight differences in deliverability create enormous revenue gaps over time, especially at scale.
| Scenario | Deliverability | Delivered | Conversions | Monthly Revenue | Annual Revenue |
|---|---|---|---|---|---|
| Strong Best | 95% | 95,000 | 1,900 | $285,000 | $3.42M |
| Average | 83.1% | 83,100 | 1,662 | $249,300 | $2.99M |
| Lost Revenue Δ vs Strong | — | 11,900 | 238 | $35,700 | $430K |
Assumptions: 100K emails/month, $150 AOV, 2% conversion rate
That’s $430,000 in lost annual revenue from the same marketing effort and budget. Same content. Same strategy. Same targeting. Different deliverability.
For businesses that rely heavily on email (such as SaaS companies, e-commerce stores, service providers, and agencies), deliverability has a direct impact on their growth trajectory. A 10-point difference in inbox placement can mean hitting revenue targets versus missing them catastrophically. Your sales team might be crushing quotas, but if emails never reach prospects, none of it matters.
The gap between winning and losing isn’t due to the quality of your offer or messaging brilliance. It’s whether anyone actually sees what you’re sending. Deliverability is revenue, not a technical metric.
How do you fix your email deliverability?
A proper email warmup that analyzes your actual campaigns and replicates them naturally helps build an email reputation authentically.
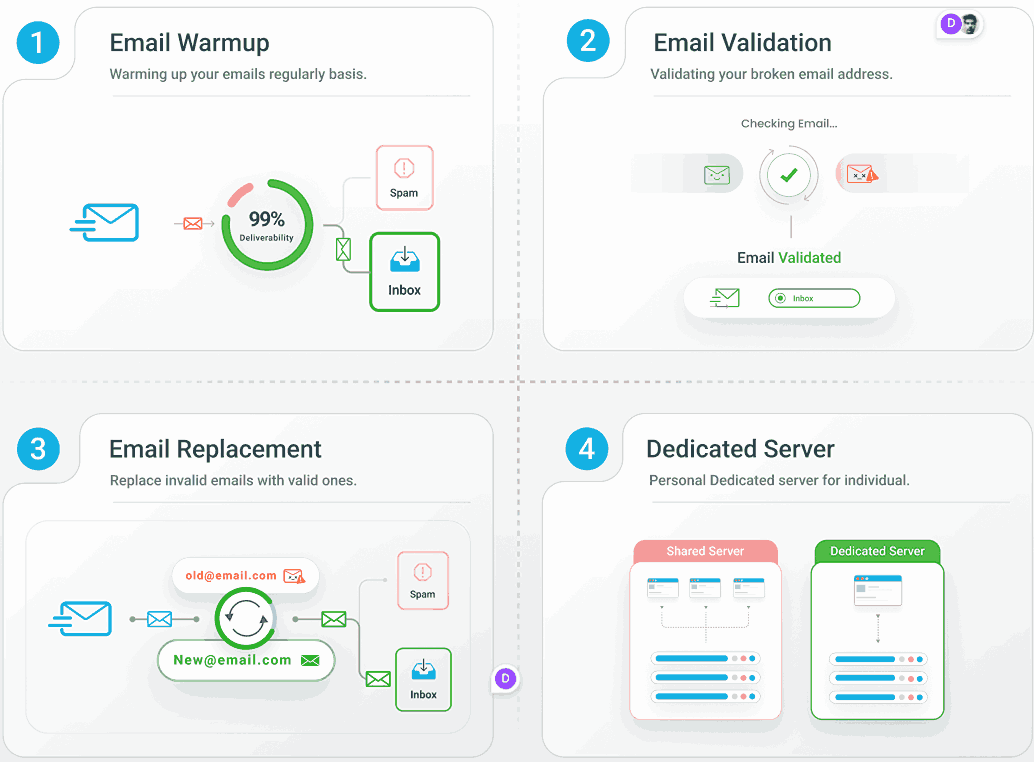
Many tools send generic emails that ESPs instantly spot and flag (damaging your reputation instead of building it). You need personalization that matches your actual sending patterns, not templates — something that EmailWarmup.com brings to the table.
The fundamentals haven’t changed, but enforcement has become dramatically stricter in 2025.
Authentication setup
Implement SPF, DKIM, and DMARC configurations properly. This is no longer optional (Microsoft, Gmail, and Yahoo all require it for bulk senders). Misconfigured authentication means your emails get rejected before they even reach spam folders.
Real-time monitoring
Catch problems before they damage campaigns. Set up alerts for sudden drops in open rates, spikes in bounce rates, or increases in spam complaints. By the time you notice deliverability problems manually, you’ve already lost thousands of dollars in revenue.
Aggressive list hygiene
Remove unengaged subscribers regularly. If someone hasn’t opened an email in 6 months, they’re actively hurting your sender reputation. Sending to unengaged recipients signals to ISPs that your emails aren’t wanted (which triggers filtering for everyone on your list).
Content optimization
Reduce marketing-heavy language and minimize link density. This doesn’t mean avoiding promotional content entirely (that’s what you’re sending), but concentrating too many marketing terms or links in one email triggers algorithmic flags.
Engagement focus
Prioritize subscribers who actually open and click on your emails. Segment your list by engagement level and send your most important campaigns to your most engaged users first. This builds positive reputation signals that help your emails to the less engaged segments perform better.
Email deliverability checklist
You can use this checklist to audit your current setup and identify gaps.
Deliverability Compliance Checklist
| Category | Requirement | Status |
|---|---|---|
| Authentication | ||
| Authentication | ||
| Authentication | ||
| Authentication | ||
| List Hygiene | ||
| List Hygiene | ||
| List Hygiene | ||
| Monitoring | ||
| Monitoring | ||
| Monitoring | ||
| Content | ||
| Content | ||
| Content |
Services that combine automated warm-up with expert consultation effectively address the SMB challenge. Small businesses lack the dedicated email infrastructure teams that enterprises employ. External expertise becomes critical for maintaining competitive deliverability rates without building internal capabilities from scratch.
The key is consistency. Deliverability isn’t a one-time fix. It’s an ongoing practice requiring constant monitoring, adjustment, and maintenance. Authentication protects against spoofing. List hygiene prevents spam trap hits. Engagement optimization signals value to filters. All three must work together continuously.
What happens next with email filtering?
The 2025 policy landscape suggests two divergent trends over the next few years. Understanding both helps you prepare your strategy (rather than getting blindsided by changes).
Short-term chaos (2025-2026)
Microsoft’s DMARC enforcement, starting May 2025, introduces temporary but significant chaos. Expect spikes in commercial emails routed to Junk as technically non-compliant senders get penalized. The “spam” metric will inflate artificially from legitimate businesses failing authentication requirements (not from increased malicious activity).
Companies that achieve early DMARC compliance will gain a competitive advantage, while their rivals struggle with deliverability issues. The average legitimate deliverability for compliant senders is likely to improve as non-compliant senders are filtered out or forced to improve their practices. The market rewards early adopters who take compliance seriously.
Medium-term stability (2026-2027)
As non-compliant senders implement proper authentication or face outright rejection, the ecosystem should stabilize at a healthier baseline. The long-term policy trend clearly rewards senders maintaining stringent technical standards and high user engagement.
However, the total malicious spam volume (currently hovering around a 46-47% share) is likely to continue rising. Generative AI removes scaling limitations that previously constrained attackers. Expect continued escalation in phishing sophistication and volume, driving a permanent arms race between AI-driven threats and behavioral defenses. Security becomes an ongoing investment, not a solved problem.
Predicted email landscape (2025-2027)
The next few years will dramatically reshape email marketing as authentication mandates and AI threats converge.
Microsoft enforcement causes deliverability chaos (temporary)
Non-compliant senders lose 30–50% delivery
AI phishing volume doubles again
Authentication becomes universal requirement
Compliant senders see improved performance
Segmented inboxes become default everywhere
Ecosystem stabilizes at higher security baseline
Engagement metrics replace open rates
AI detection arms race accelerates
The future of categorization
Segmented inbox experiences (Primary versus Promotions, Focused versus Other) will become universal across email providers. Within five years, all major mailbox providers will implement automatic categorization similar to Gmail’s current system.
The old metric of “email delivered” becomes meaningless when most delivered emails land in secondary tabs that users check less frequently. Success metrics must evolve to emphasize the quality of engagement, including replies, forwards, and saves, rather than simply focusing on opens. Open rates tell you nothing if people glance and delete without engaging.

Companies that create genuine engagement will thrive regardless of where they are placed. Those relying on spray-and-pray tactics will see diminishing returns as filters grow more sophisticated. The future belongs to senders who build actual relationships with recipients, not those who blast messages hoping something sticks. Quality beats quantity. Always has. Always will.
References used in this report
- Litmus. “Email Marketing ROI Guide.”
- DeBounce. “Email Spam Statistics 2025.”
- Verizon. “2024 Data Breach Investigations Report.”
- Litmus. “Email Client Market Share (September 2025).”
- Mailgun. “Microsoft Outlook Sender Requirements 2025.”
- Microsoft Tech Community. “Strengthening Email Ecosystem”
- Omnisend. “Improve Email Deliverability: In-Depth Guide For 2025.”
- Email Tool Tester. “Email Deliverability Test Results [January 2024].”
- dmarcian. “Microsoft Enforces SPF, DKIM, DMARC for High-Volume Senders.”
- PRNewswire/Gen Digital. “Q1/2025 Gen Threat Report Reveals AI-Driven Scams”
- ActiveCampaign Help. “How Does the Gmail Promotions Tab Affect My Campaigns?”
- Statista. “Number of sent and received e-mails per day worldwide from 2018 to 2028.”
- GlockApps. “Updated Email Deliverability Statistics: How Did 2025 Begin for Email Senders?”
- Email Tool Tester. “Spam Statistics 2025: Survey on Junk Email, AI Scams & Phishing.”
- Apple Newsroom. “iOS 18 Makes iPhone More Personal, Intuitive, and Intelligent.”
- Google Blog. “Protecting Users with Our 15 Billion Strong Spam-Battling Army.”
- Email on Acid. “Gmail Promotions Tab: Is It Really That Bad for Marketers?”
- Google Support. “Email Sender Guidelines Spam Rate Clarification.”
- Keepnet Labs. “2025 Phishing Statistics: (Updated August 2025).”
- Sift. “Q2 2025 Digital Trust Index: AI Fraud Data and Insights.”
- Email Tool Tester. “Email Deliverability Statistics (2025).”
- IBM Security. “Cost of a Data Breach Report 2024.”
- Google Support. “Bulk Sender Requirements.”
- FBI IC3. “2024 Internet Crime Report.”
- Mailmodo. “Email Spam Statistics.”